Correlating security events across different log sources
All enterprises, large and small, across different industries and geographies, are vulnerable to security threats to their valuable data. To detect and respond to these threats, organizations use commercial security information and event management (SIEM) solutions to gather security-related information and identify potential security issues. With the constantly changing techniques used by adversaries in the evolving threat landscape, it is increasingly necessary to monitor adversary actions across devices, hosts, and applications.
OpenSearch Security Analytics is an open-source solution for security practitioners that addresses the cost and complexity of running security operations by automating threat detection and threat analysis. It provides a single pane of glass for observability (logs, metrics, and traces) and security monitoring use cases, saving OpenSearch users the cost of cloning data in multiple places, and provides long-term retention of security event data. Due to OpenSearch’s flexible nature, Security Analytics can also be used for less critical workloads that don’t justify the high cost of a commercial security solution.
The Security Analytics correlation engine helps you analyze different security event logs and identify relationships between them to find highly correlated events. This blog post details how Security Analytics can provide a better fidelity of data when viewed through a correlation graph, which can help security analysts monitor their systems and applications more effectively.
What is Security Analytics?
With many enterprises bringing an increasing number of critical workloads online, Security Analytics reduces the complexity and cost of running security operations. It achieves this through the Security Analytics threat detection engine, which comes preloaded with a set of detection rules that you can customize and extend based on your security needs. You can further optimize the threat detection engine to raise only actionable alerts by identifying even sequences that match a standard or custom attack pattern. Detectors are also classified into popular frameworks, such as the MITRE ATT&CK framework, and assigned a risk score, which can be further adjusted based on external threat intelligence sources.
When you ingest data from various log sources, Security Analytics dashboards show a real-time view of all threat detections, classified by threat type. A user can add log ingestion from one of their existing security products or directly ingest logs from various supported log sources. The prepackaged rules are executed against the log data to generate findings/threats, which are represented on a visual dashboard including severity, category, and actionable steps/playbooks. You can author new threat rules or use the log pattern detection capabilities to automatically create a threat detection rule.
Before we dive deeper into Security Analytics and the correlation engine, it’s useful to know a couple of important terms related to threat detection.
Detectors
Detectors are core components that are configured to identify a range of cybersecurity threats corresponding to an ever-growing knowledge base of adversary tactics and techniques maintained by the MITRE ATT&CK organization. Detectors use log data to evaluate events occurring in the system. They then apply a set of security rules specified for the detector and determine findings from these events.
Findings
Findings are generated every time a detector matches a rule with a log event. Findings do not necessarily point to imminent threats within the system, but they always isolate an event of interest. Because they represent the result of a specific definition for a detector, findings include a unique combination of selected rules, a log type, and a rule severity. As such, you can search for specific findings in the Findings window, and you can filter findings in the list based on severity and log type.
What is the correlation engine?
The Security Analytics threat detection engine converts detection rules into executable OpenSearch queries. The queries are then matched against the logs or events ingested into your OpenSearch instance and used to generate findings. Trigger condition filters are applied to the findings to generate alerts. However, because the generated findings and alerts belong to individual logs types, there is no easy way to correlate between them.
The correlation engine helps correlate finding across log sources by allowing you to define different threat scenarios. The engine first identifies the defined threat scenarios in the logs generated from an individual log category and then automatically generates correlations between findings from different log categories. This practice of defining and correlating threat scenarios is called a correlation framework.
Why do I need a correlation framework?
Because data spans multiple security event logs (Amazon S3 access, VPC Flow Logs, syslog, DNS), a finding from just one log source is not enough to increase the confidence of the finding. A strong correlation across logs helps customers to dive into the data relationships across different sources.
To understand a correlation between findings from different log sources, you would need to manually browse through a list of generated findings for individual log categories and identify any patterns.
The following example customer infrastructure diagram further illustrates the need for a correlation framework. This customer deploys a Django REST application hosted on an Amazon EC2 Windows instance. The REST APIs for the application use Active Directory as the identity provider and Amazon S3 to store and query files. The EC2 Windows instance stores incoming network traffic in VPC Flow Logs.
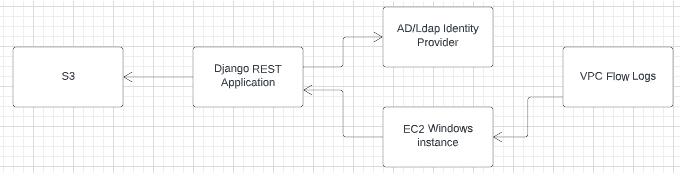
For Security Analytics to monitor and detect threats for this infrastructure, we need to the define a detector for each component in the infrastructure. The following diagram shows the infrastructure with a detector for each component, such as a network detector for VPC Flow Logs and a Windows detector for the EC2 Windows instance.
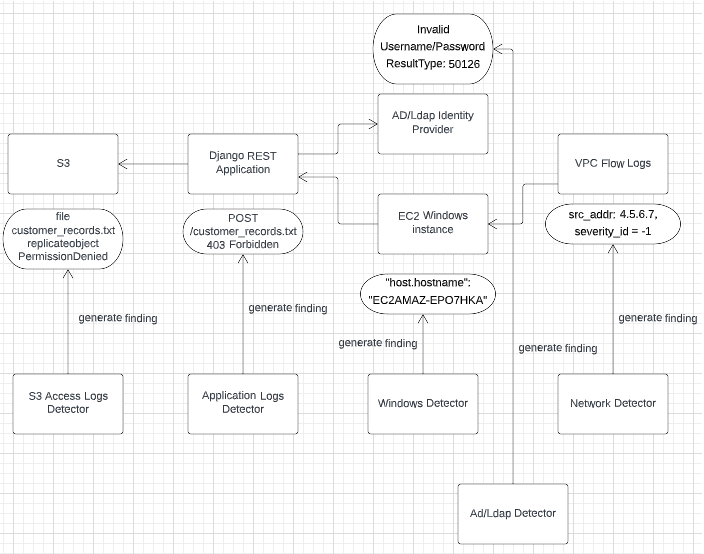
With the detectors set, we can simulate a security attack on this example infrastructure. The attacker uses the sbcd90 user to call a REST API named POST /customer_records.txt, which tries to replicate a sensitive file named customer_records.txt from Amazon S3.
When the attack occurs, each detector generates a finding for its corresponding infrastructure component. For example, the AD/LDAP detector generates a finding that indicates Invalid Username/Password, ResultType: 50126. This finding belongs to the individual detector’s log type.
But how would you know that the AD/LDAP detector finding Invalid Username/Password, ResultType: 50126 is related to a chain of security events occurring in the same time frame on the infrastructure, such as a 403 Forbidden error finding from an application logs detector? Is there a way to correlate finding that belong to other log types in a particular time range automatically? Correlation engine makes all of this possible.
Benefits of the correlation engine
From inside OpenSearch Dashboards, the correlation engine provides a security finding knowledge graph that can be used to store connected findings and generate correlation insights based on the time ranges from which those findings were logged. You can generalize the concept of “correlation” as “joining events across different data sources.”
Visualizing correlations
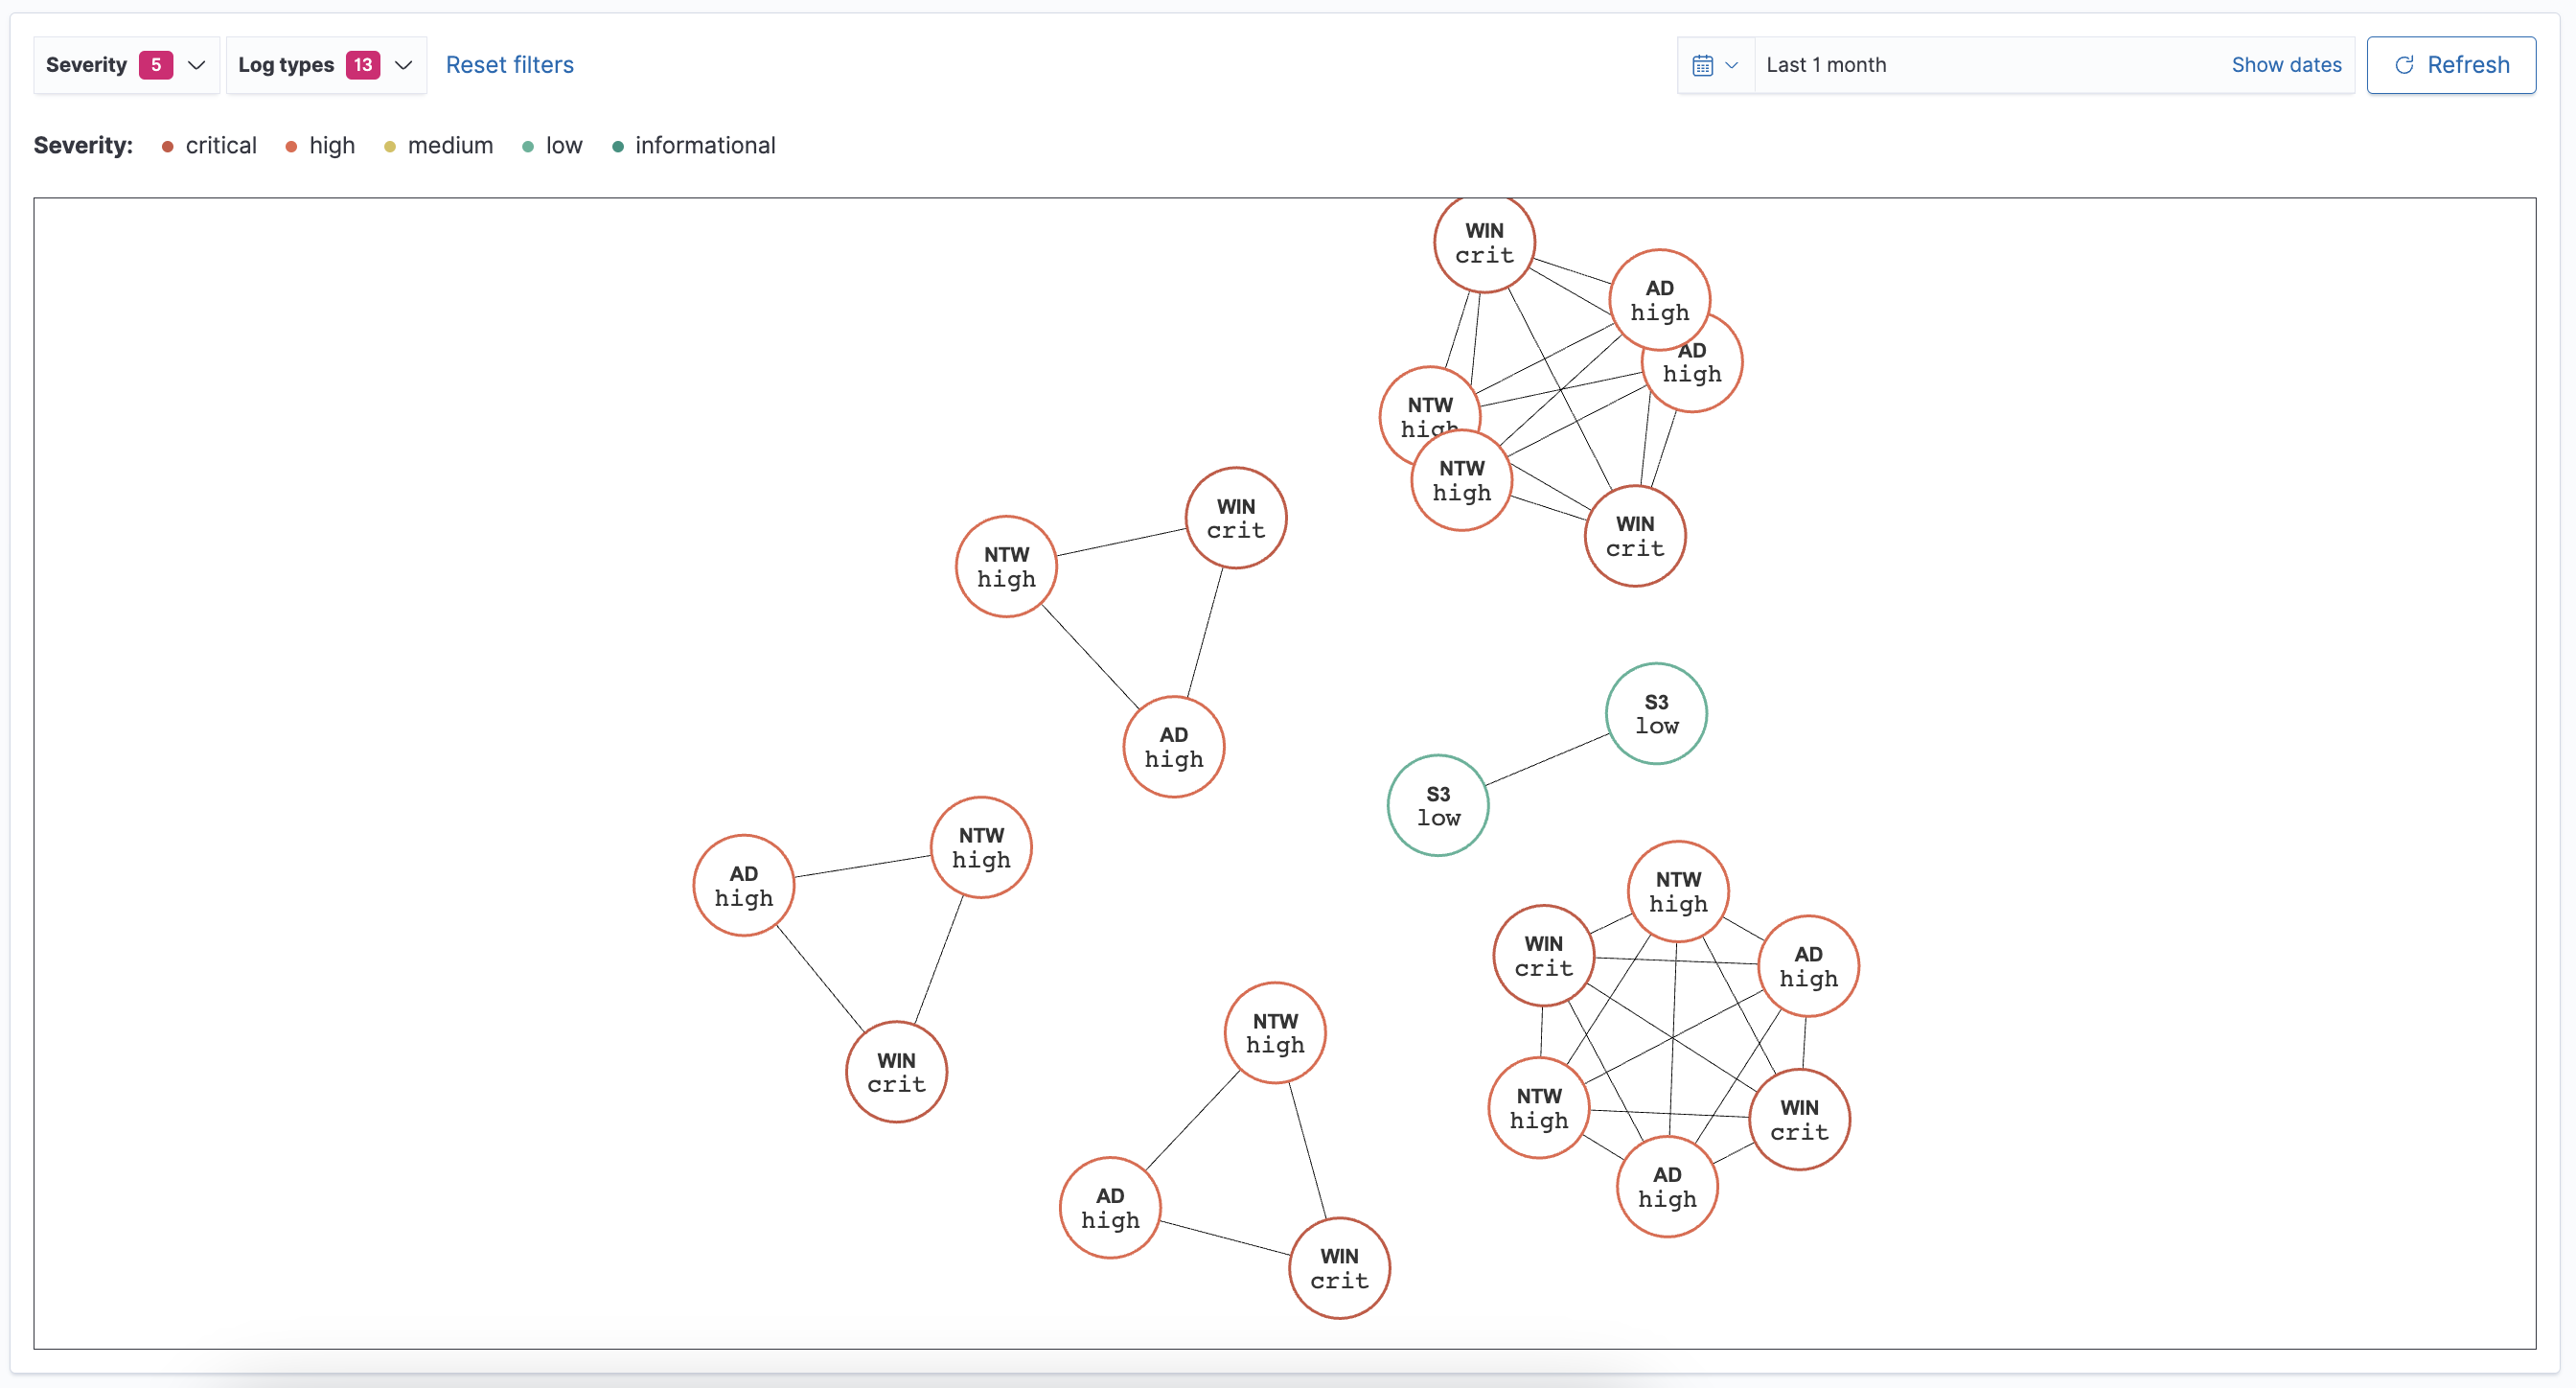
To visualize correlations, log in to OpenSearch Dashboards and navigate to Security Analytics > Overview > Correlations. The correlations page shows a graph of findings connected to each other. The graph displays findings as nodes with colored borders expressing their severity level. A three-letter abbreviation inside the node indicates the log type. The lines that connect the findings represent the correlations between them. A heavy line indicates a strong correlation, while a light line indicates a weaker correlation, as shown in the following image.
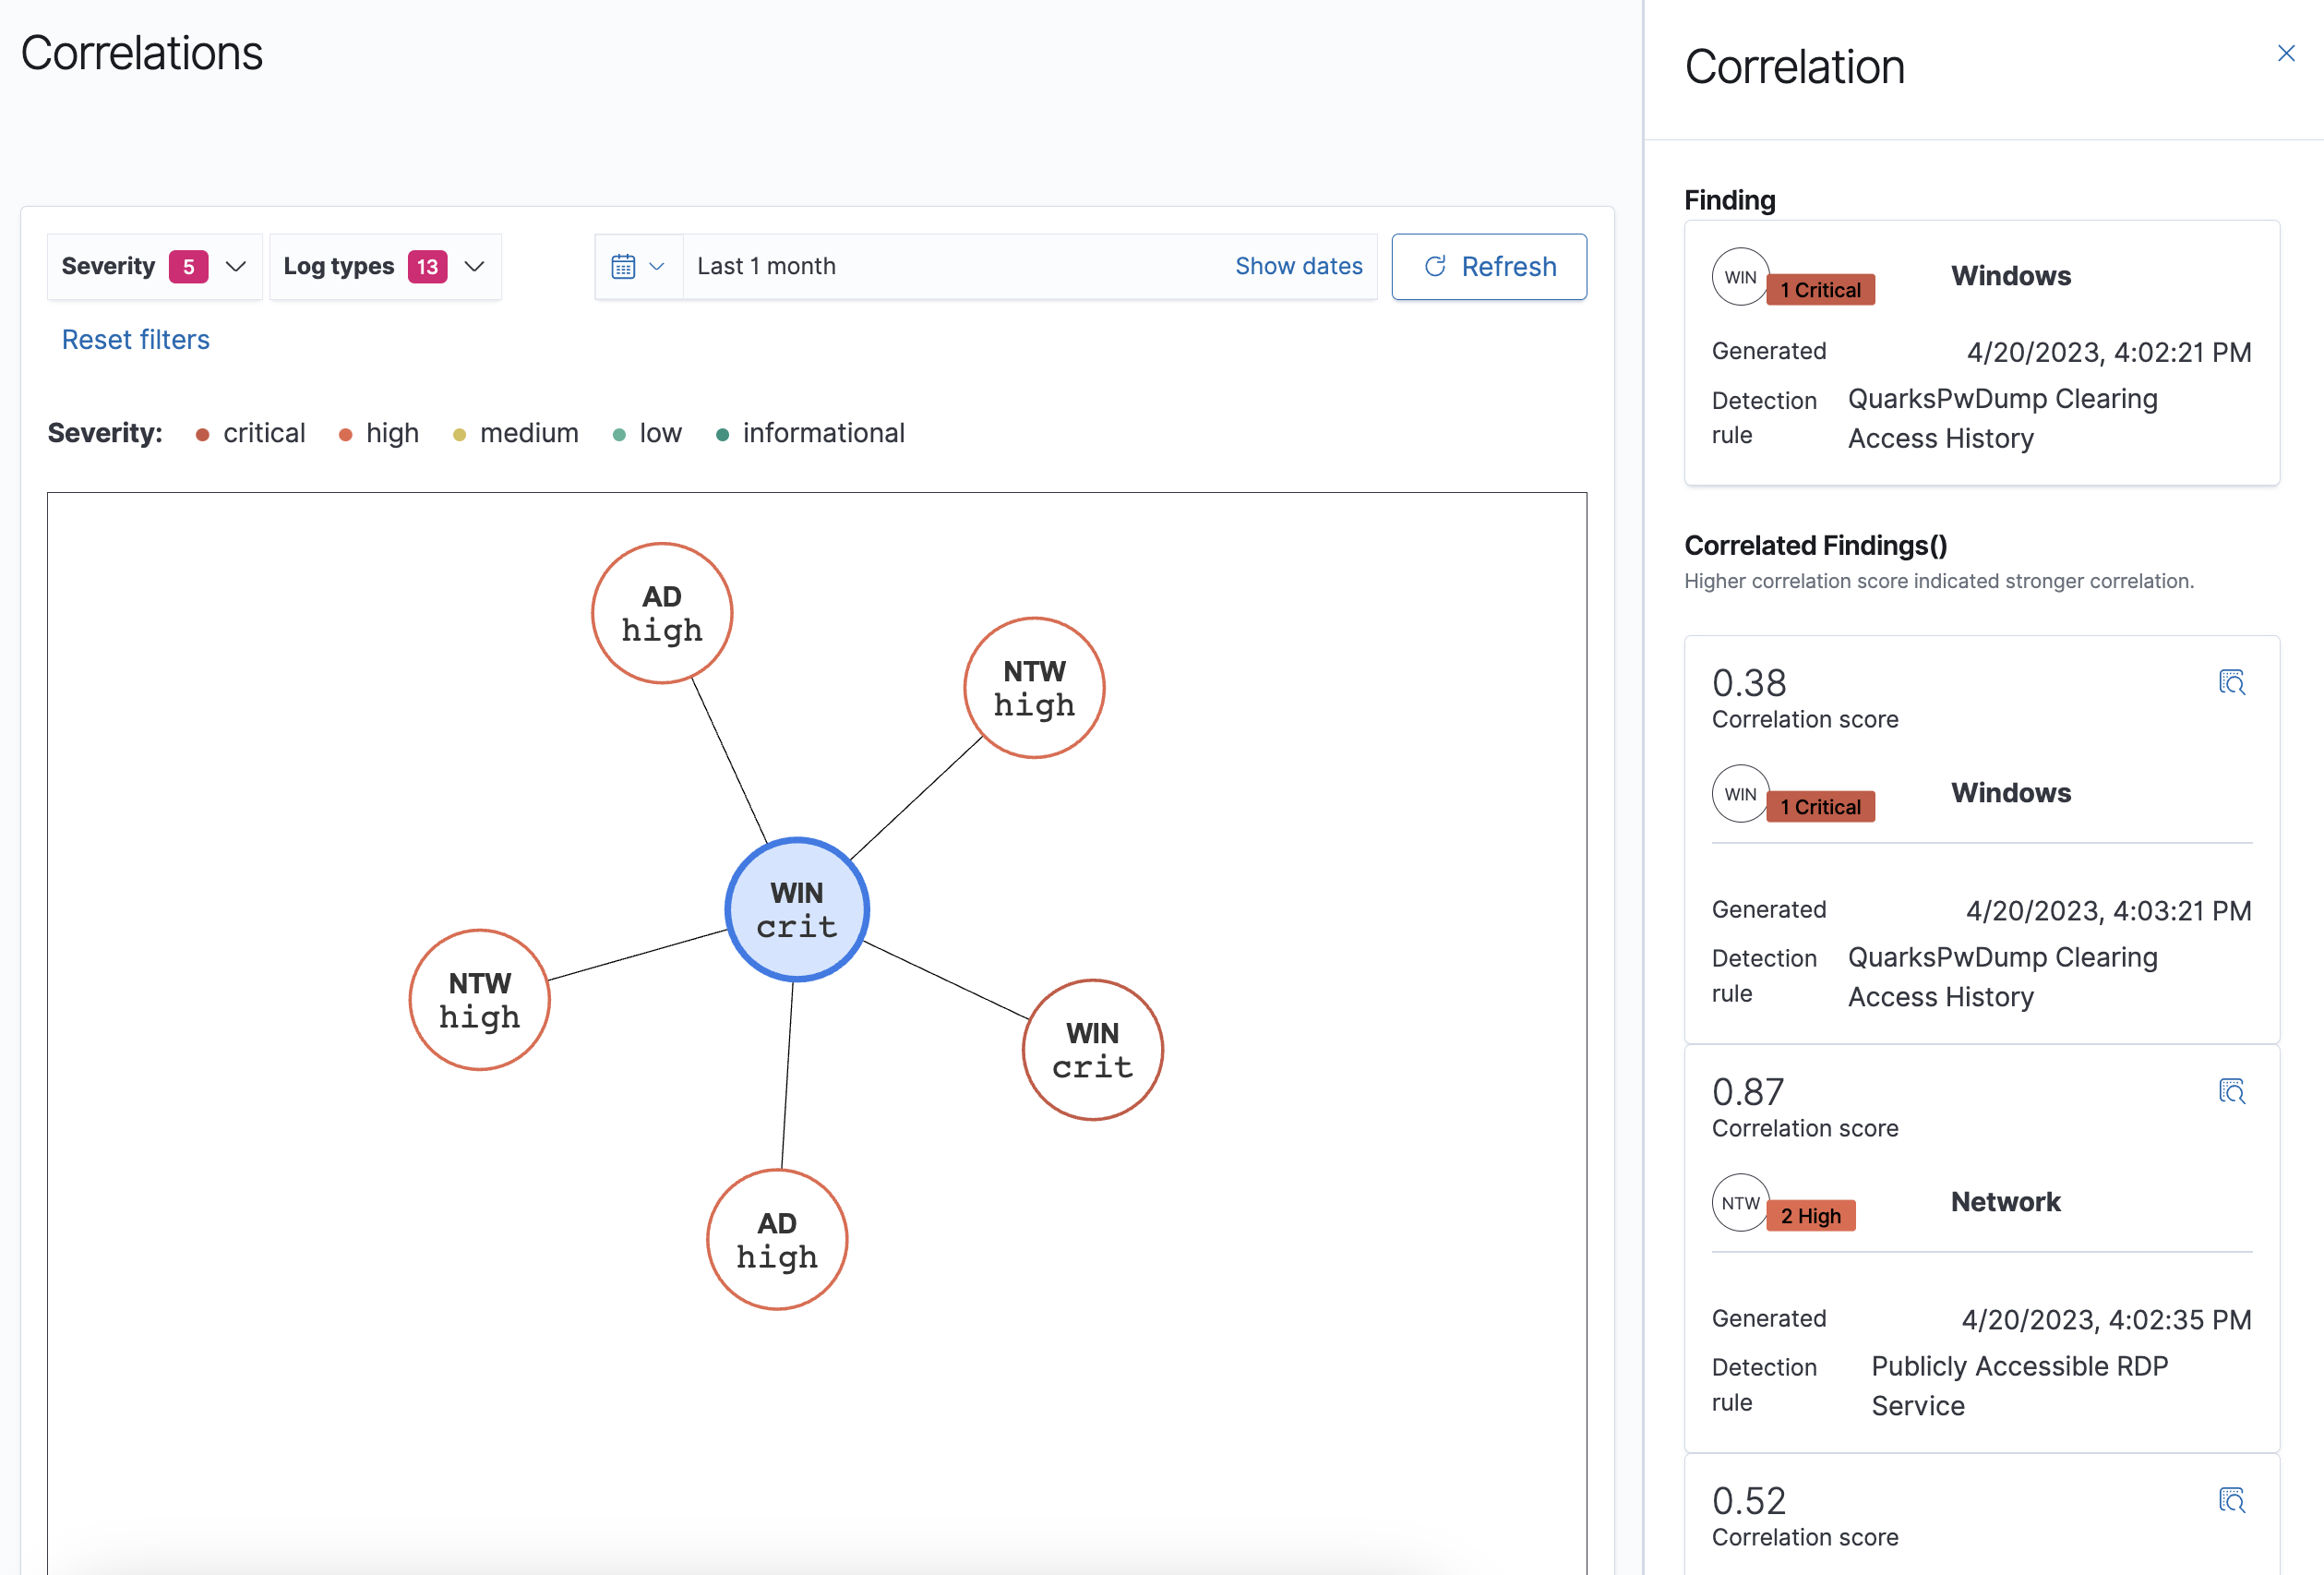
When selecting a finding, a panel appears with detailed information about the finding, including the following:
- Log type
- Rule severity
- The time of the finding
- Rule information
All findings also contain a correlation score, a metric that measures how strong the correlation is between two findings. The higher the correlation score, the stronger the correlation, as shown in the following image.
You can sort correlations by severity, log type, or by changing the time range.
Creating a correlation rule
Correlation rules allow you to define threat scenarios involving multiple systems in an infrastructure by matching the signatures of threat events occurring in different log types. Once a rule contains at least two different log sources and the preferred fields and field values that define an intended threat scenario, the correlation engine can query the indexes specified in the correlation rule and identify any correlations between the findings.
For instructions on how to create correlation rules, see Creating correlation rules.
Exploring findings
Finally, the Findings window includes features for viewing and working with findings. The two main features are:
- The bar graph with findings information arranged by count, date, and log type or rule severity.
- The Findings list arranged by time, finding ID, rule name, and other details.
For more information about using the Findings window, see Working with findings.
Next steps
To get started using the correlation engine, see Setting up Security Analytics and Creating correlation rules in the OpenSearch documentation.