OpenSearch 2.4.0 is available today!
OpenSearch 2.4.0 brings Windows support, security analytics, new geospatial features, and a variety of upgrades for search, analytics, and observability use cases
The final minor release of 2022 extends the OpenSearch Project toolkit with more than 25 features and enhancements across a range of use cases like geospatial, search, security analytics, observability, and more. Support for Windows environments and other firsts for the project are now ready to put to work in your environment. Read on for a rundown of the new functionality you can build on with OpenSearch 2.4, and check out the downloads page to get started!
Apply semantic search and sharpen results with experimental tools
For the first time, OpenSearch users can perform automated semantic search on their documents, enhancing search results with additional meaning and context provided by machine learning (ML) models. A new collection of features, experimental for version 2.4.0, lets you combine traditional BM25 lexical search with deep-learning-powered semantic search, offering new ways to tune your search queries for increased relevance, recall, and precision. Enabling this functionality is a new plugin that allows you to upload your ML models, vectorize your documents and your queries, and search your documents using k-NN.
OpenSearch 2.4.0 also supports building language models tuned to your document collection as an experimental functionality. Fine-tuning semantic search models for a particular set of documents is important for the best results but has sometimes been difficult because it has generally required large volumes of training data. With this release, you can now use a pretrained query generator model that creates query-response pairs using your own documents.
You’ll need to enable this functionality in your YAML configuration to access these tools. As experimental features, the semantic search tools in this release are recommended for use outside of production environments. We’re excited for you to explore these capabilities with your document stores and hope to see any and all feedback about semantic search here.
Additionally, a new plugin that lets you compare different ranking techniques, including semantic search, side by side in the UI is included as an experimental tool. For example, you can compare the results of a BM25 search against the results from your ML model so that you can see the two rankings and tune your results accordingly.
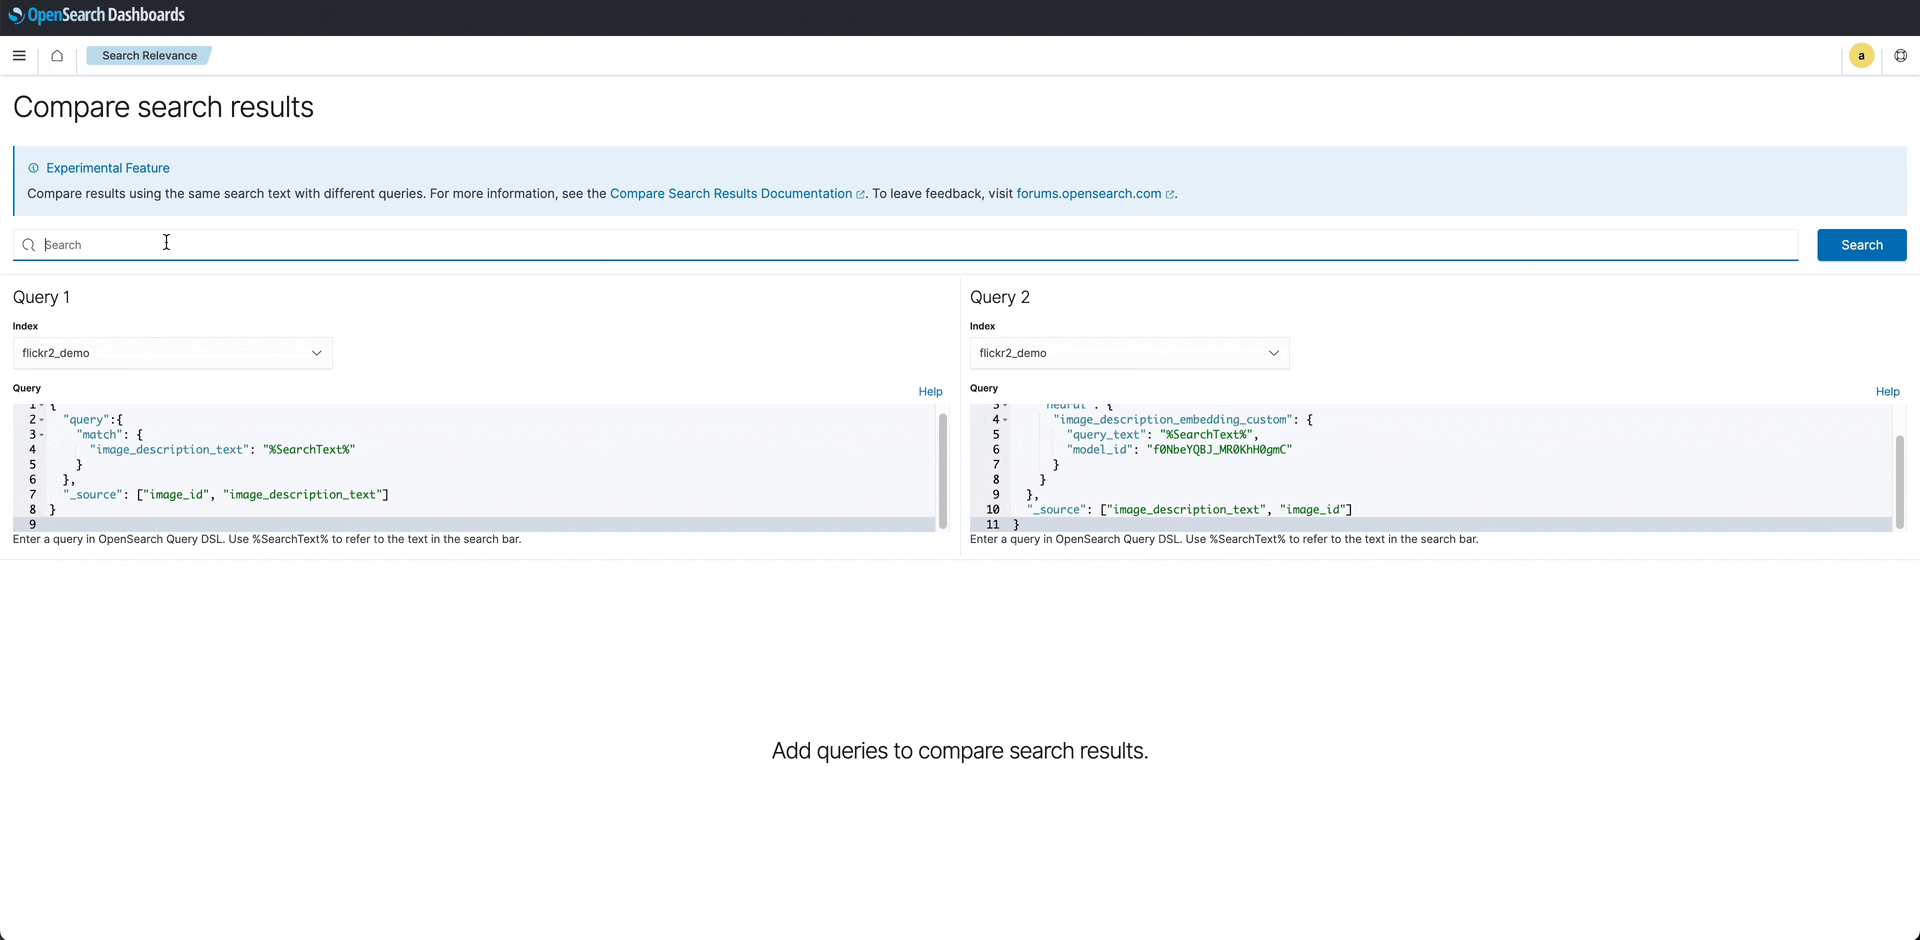 Search Comparison: The search comparison tool shows two sets of results for the image search “wild west.” The search on the left uses BM25; at right, a search using a custom language model. BM25 ignores the context of the phrase and matches “wild west” with “west” virginia state university, “wild’ animal, and “west” highland terrier. On the right, even though the captions do not contain “wild” or “west,” the terms “cowboy,” “horse,” and “rodeo” form the basis for a better match to the query.
Integrate your own ML models
The 2.4.0 release introduces the model serving framework, an experimental feature that unlocks the ability for users to upload their own ML models to OpenSearch. In this version, the framework supports integrating text-embedding models to power semantic search. This release is a first step toward making it easier to integrate and operationalize ML on OpenSearch to power a variety of use cases, like visual and audio search, natural language processing (NLP)-powered analytics, and beyond. We encourage anyone using OpenSearch’s ML functionality to explore this new capability and let us know what else you’d like to see on this feature’s roadmap here.
Query your data from a specific point in time
Another new feature for 2.4.0 is Point in Time (PIT) search. Previously, there was no way to run queries against the same dataset and produce the same results; as the underlying data changed, the results of the search would change as well, making it challenging to compare and analyze query results. Now you can specify a PIT for which you want to run different queries against the same fixed dataset for consistent results. This functionality is accessible via APIs in version 2.4.0 and is planned to be enabled in the UI in a future version.
Explore a single pane of glass for analytics workloads
The OpenSearch community has asked for a “single pane of glass” through which to visualize data across different clusters in an environment. OpenSearch Dashboards takes a significant step toward meeting that challenge with the release of version 2.4.0. For the first time, OpenSearch Dashboards supports multiple data sources, allowing users to manage connections to different OpenSearch endpoints and build visualizations and dashboards with data from different OpenSearch clusters. Available as an experimental feature, this is the first of many capabilities on the project roadmap intended to provide a unified view of your data; we encourage you to try this feature outside of a production environment and share your feedback here to inform future development.
To enhance security administration, we’ve also added a feature that lets you configure different authentication types using the security plugin. Previously, users could set up a single authentication methodology (such as Basic, OpenID Connect, or SAML) for OpenSearch Dashboards; users have requested the option of configuring different ways to authenticate logins, including SSO. Now users can take advantage of this functionality with an integrated login/logout UI.
Add metrics analysis and automated log patterns to your observability stack
With this release, you can now visualize metrics data from the open-source Prometheus monitoring solution as well as from log data aggregated within OpenSearch, unlocking new observability capabilities that allow you to analyze and correlate data across logs and traces as well as metrics. Previously, the OpenSearch observability plugin only allowed you to ingest and visualize logs and traces from your monitored environments. With this feature, you can observe your digital assets with more granularity, gain deeper insight into the health of your infrastructure, and better inform root cause analysis.
You can now analyze your metrics data and correlate it with other signals to quickly track down the root cause of an issue or get a better understanding of the relationship between your infrastructure and service usage patterns. For example, you can aggregate log data to extract user throughput metrics and correlate those metrics with the infrastructure data from an external metrics store like Prometheus to see how your memory usage or compute usage scales in relation to the rise in throughput.
Also enhancing the observability solution set is the addition of log patterns to OpenSearch Dashboards. This feature auto-generates patterns from log data and makes them available for visualization and correlation. Automatically analyzing large volumes of data to detect and surface unique patterns, this feature is designed to shorten the time it takes to identify and respond to issues and make it easier to baseline and monitor patterns over time. You can use these patterns to detect outliers in your log data or identify noisy log data that you can filter away from ingestion. In 2.4.0, this feature creates log patterns based on the regex profiles of raw event data; look for additional ML-driven pattern generation in future releases.
Deploy directly on Windows
We’re delighted to share that the 2.4.0 release fulfills a long-standing request from the community to provide Windows x64 distributions for OpenSearch and OpenSearch Dashboards. That’s right; for the first time, you can deploy the OpenSearch suite directly in your Windows environment! Available in ZIP format, this distribution includes support for all OpenSearch plugins except for the performance analyzer and shares common UIs with other distributions. You can download the Windows artifacts here and refer to the documentation to help you get started.
Identify potential threats with security analytics
As users continue to extend OpenSearch to new use cases, the ability to analyze security event logs to detect and investigate potential threats has been a popular request. OpenSearch introduces a new security analytics plugin for OpenSearch and OpenSearch Dashboards, experimental in 2.4.0, with an array of tools to help you identify attack signatures, create alerts from security findings, and visualize threat patterns using dashboards. With 2,000+ prepackaged open-source Sigma rules and support for multiple log sources, including Windows, Netflow, DNS, AWS CloudTrail, and more, security analytics provides you a range of options to help you protect your data and business-critical infrastructure.
Enhance cluster resiliency
This release also brings a number of enhancements to OpenSearch usability and new features designed to improve cluster reliability and resiliency.
Cluster manager task throttling lets you set limits on the volume of tasks submitted by data nodes to the cluster manager node. By throttling the incoming tasks submitted to the cluster manager, you can avoid scenarios in which spikes in the number of pending tasks can affect the cluster manager’s performance, which can impact cluster availability.
Search backpressure supports enhanced resiliency by protecting OpenSearch clusters against traffic surges and other issues that can overwhelm cluster resources and lead to degraded performance or failures. This feature monitors the resources required for individual search requests and can route requests to different nodes based on resource availability. This can help keep nodes and clusters stable during periods of high demand.
A new weighted zonal search request routing policy takes advantage of OpenSearch’s distributed processing framework to allow you to configure policies to route search traffic away from zones that have degraded performance or failures.
Restore snapshots functionality lets you restore your data from existing snapshots through the OpenSearch Dashboards UI. In the 2.1.0 release, the OpenSearch Project introduced snapshot management as part of the Index Management (IM) plugin, enabling automated snapshots to back up user data from OpenSearch indexes. Previously, restoring your snapshots required you to use the restore API.
Simplify storage management and recovery with searchable snapshots
Another new capability designed to help you manage your snapshots is the searchable snapshots feature. Now you can search indexes that are stored as snapshots within remote repositories without the need to download all of the index data to disk ahead of time, allowing you to save time and conserve storage capacity. This experimental feature represents phase two of the project’s storage roadmap, which aims to improve the performance, scalability, and cost of OpenSearch as part of the project’s high-level vision for storage. To share your feedback on this feature, please open a GitHub issue.
New functionality for geospatial data
OpenSearch 2.4.0 also expands OpenSearch Dashboards’ geospatial tools with two new data field types: The xy point field and xy shape field let you index and search geographic points represented as Cartesian coordinates or as Cartesian shapes, respectively. These field types join the latitude-longitude data field type previously offered for geographic data. Another new feature, GeoHex grid aggregation, lets you use datasets that use the Hexagonal Hierarchical Geospatial Indexing System (H3) for indexing and visualization with OpenSearch Dashboards coordinate maps.
Get started with OpenSearch 2.4.0
You can download the latest version of OpenSearch here, and you can explore OpenSearch Dashboards live on the playground. You can learn more about all the capabilities we’ve discussed here and much more in the release notes and documentation, as well as the documentation website release notes. And check back here regularly for future blog posts as we dive deeper into the new features included in OpenSearch 2.4.0.