Overlaying anomalies and alerts on OpenSearch Dashboards visualizations
We have some exciting news to share with you!
We have taken the first step toward our vision of offering plugin functionality in the dashboards the community loves. We have added the anomaly and alerting detector and monitor creation workflows, respectfully, into the dashboarding experience. Prior to 2.9, users had to remember the details of what they were looking at in a dashboard and then navigate away from it to the Anomaly Detection and Alerting plugins to create the detectors and alerts.
No more. Now users can create anomaly detectors and alerting monitors directly from their OpenSearch Dashboards line chart visualizations with select aggregations. After creating the new detector or monitor/alert, users can view anomalies or alerts overlaying the configured visualization. For users who have defined detectors or monitors, they can associate their existing detectors or monitors with the visualization, which helps track services that are not specific to the visualization, such as a dependent service.
In this blog post, you’ll learn how to create a new anomaly detector or alerting monitor from a saved visualization and add existing monitors and detectors to a visualization instead of using the Alerting or Anomaly Detection plugin pages. If you have already set up detectors and monitors, you’ll learn how to associate them as well. Lastly, you will see how the events overlay onto the visualization, helping drive root cause analysis more efficiently by identifying which events were triggered. Hold on tight!
Terms to know
Here are a few terms you need to know:
- OpenSearch Dashboards visualizations are visualizations defined within a dashboard.
- The Anomaly Detection plugin is a free OpenSearch plugin that uses the Random Cut Forest (RCF) algorithm (that is, an unsupervised algorithm for detecting anomalous data points within a dataset) to detect anomalies in aggregated data.
- The Alerting plugin is a free OpenSearch plugin used to monitor and trigger alerts on OpenSearch health and machine-generated logs.
Getting started
The functionality is automatically enabled. You can turn it off by going to OpenSearch Dashboards > Stack Management > Advanced Settings and toggling off Enable plugin augmentation, which is in the Visualization pane. Before getting started, make sure you have:
- Installed OpenSearch and OpenSearch Dashboards version 2.9 or later. See Install and upgrade OpenSearch.
- Installed the Anomaly Detector and Alerting plugins. See Managing OpenSearch Dashboards plugins for more information.
- Started your local environment. Because OpenSearch Playground is read-only, use your local environment to perform the steps in the following tutorials.
Note that only y-axis metric (count, average, max, and so forth) aggregations and x-axis date histogram aggregations are currently supported.
Creating a monitor or detector through a visualization
To create a new monitor or detector through a visualization, first save your dashboard. Then select Alerting or Anomaly Detection from the Options dropdown context menu. The following image shows a snapshot of the interface. Tip: If you are using static thresholds (for example, metrics to monitor CPU spikes, memory usage, or disk usage), create an alerting monitor; otherwise, create an anomaly detector.
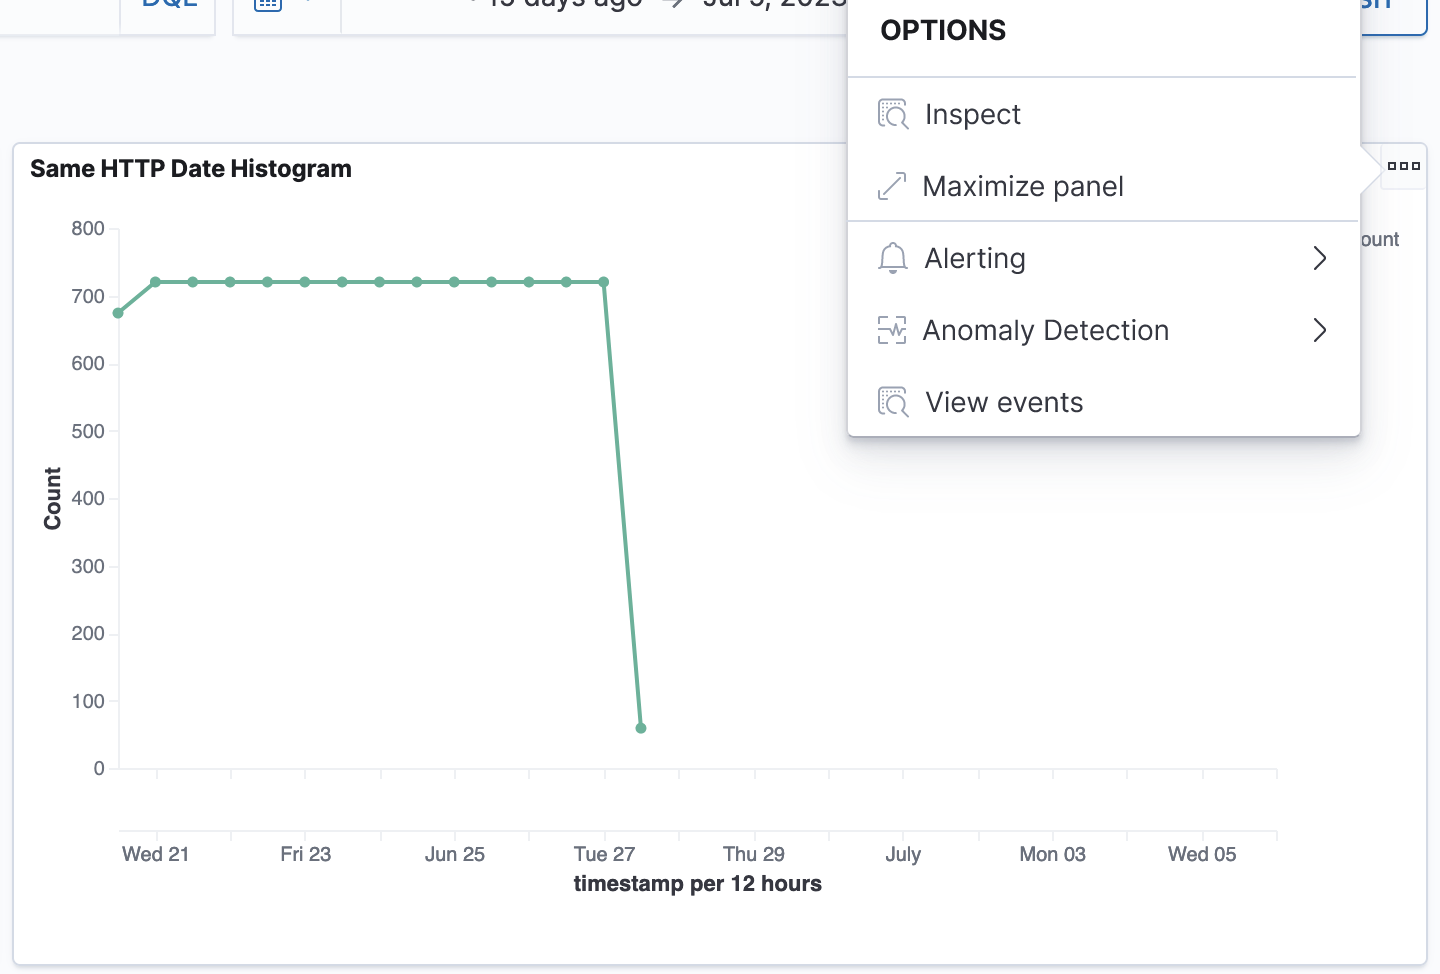
Figure 1. Dashboard panel with Options context menu
Regardless of whether you choose Alerting or Anomaly Detection, certain information about alerts and anomalies, based on the visualization’s data, is automatically populated. Optionally, instead of creating a new monitor or detector, you can associate existing monitors or detectors. The following tutorials guide you through these workflows.
Adding a detector through a visualization
To add a detector through a visualization, you have two options: create a new detector or associate an existing detector. Choose the option that meets your use case. The following steps cover both options:
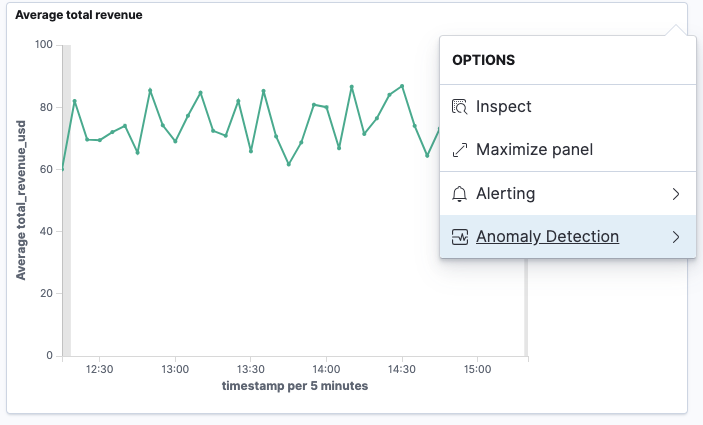
- On your visualization, select Anomaly Detection from the Options dropdown context menu, as shown in the following image.
Anomaly Detection context menu interface
Figure 2. Anomaly Detection context menu
- Select Add anomaly detector from the Anomaly Detection dropdown context menu, as shown in the following image.
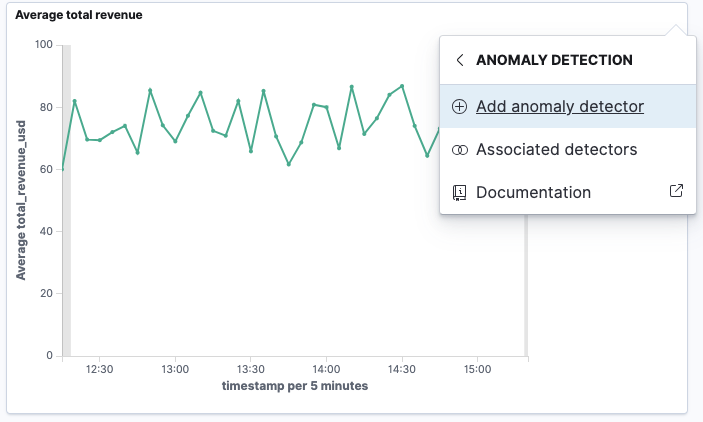
Figure 3. Add anomaly detector context menu
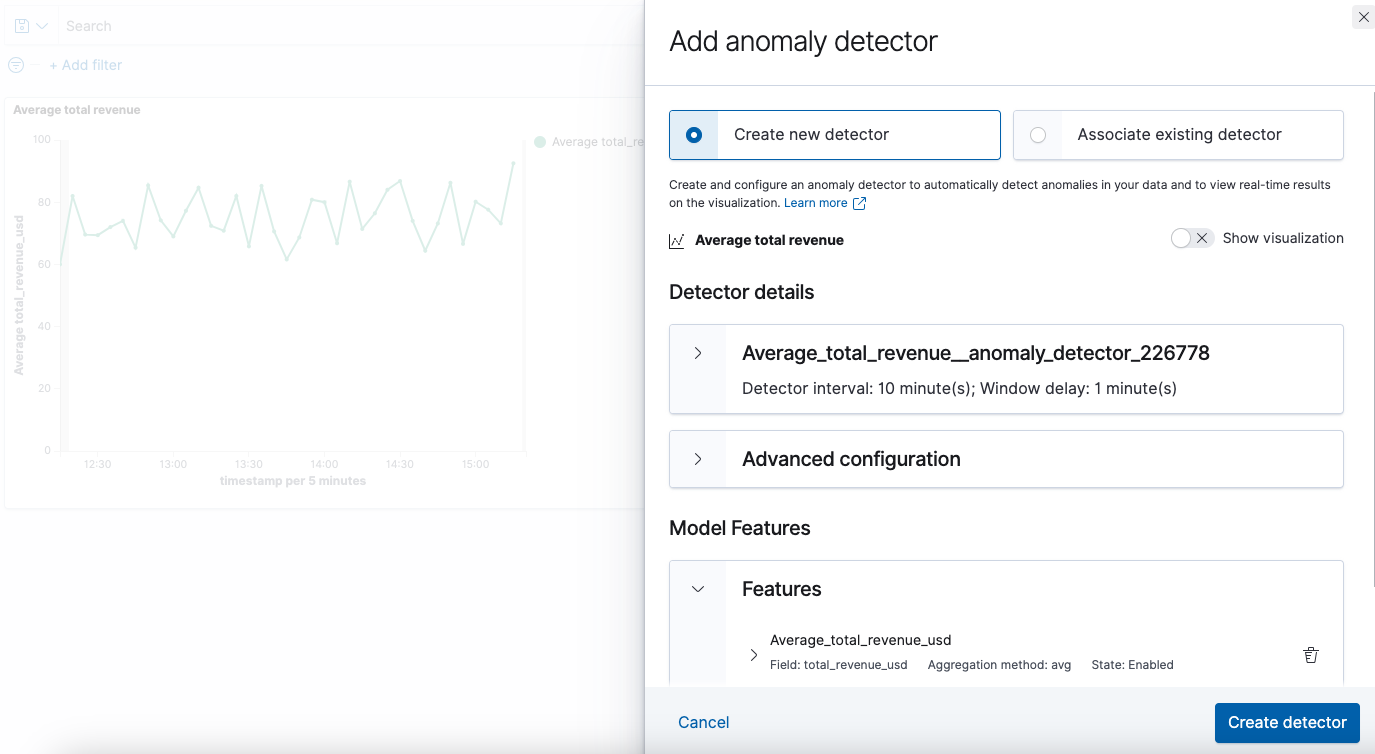
- Choose Create new detector or Associate existing detector.
- If you choose to create a new detector, input the required information under Detector details and Model Features.
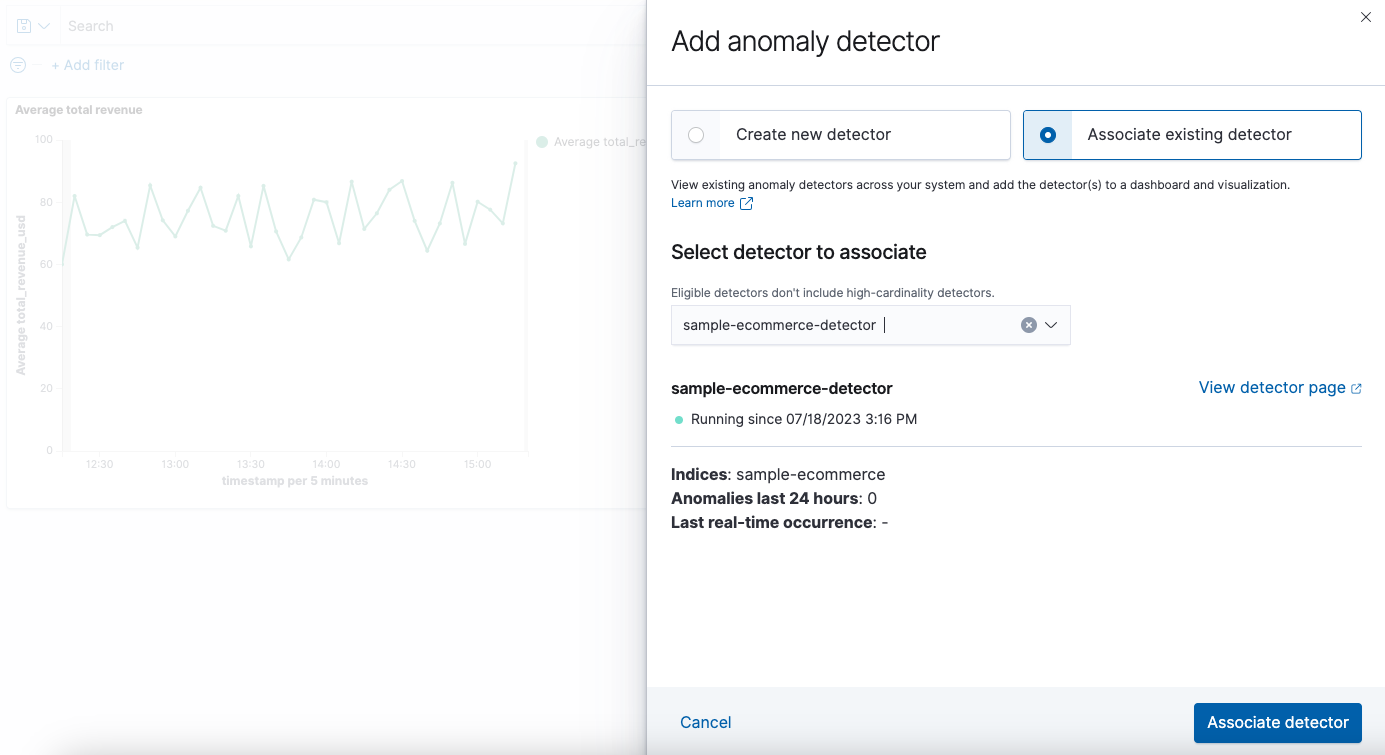
- If you choose to associate an existing detector, select a detector from the dropdown list under Select detector to associate.
- Select Create detector or Associate detector, as applicable, to add the detector to your visualization, as shown in the following images.
| Create detector | Associate detector |
|---|---|
 |
 |
Note that if the Alerting plugin is enabled in your cluster, you’ll have the option to create a monitor on top of the anomaly detector. To do this, select Set up alerts from the success notification pop-up you receive upon successfully creating the detector. The anomaly detector is prepopulated as a definition method for the alerting monitor.
Adding a monitor through a visualization
To create a monitor through a visualization, you have two options: create a new monitor or associate an existing monitor. Choose the option that meets your use case.
- On your visualization, select Alerting from the Options context menu, as shown in the following image.
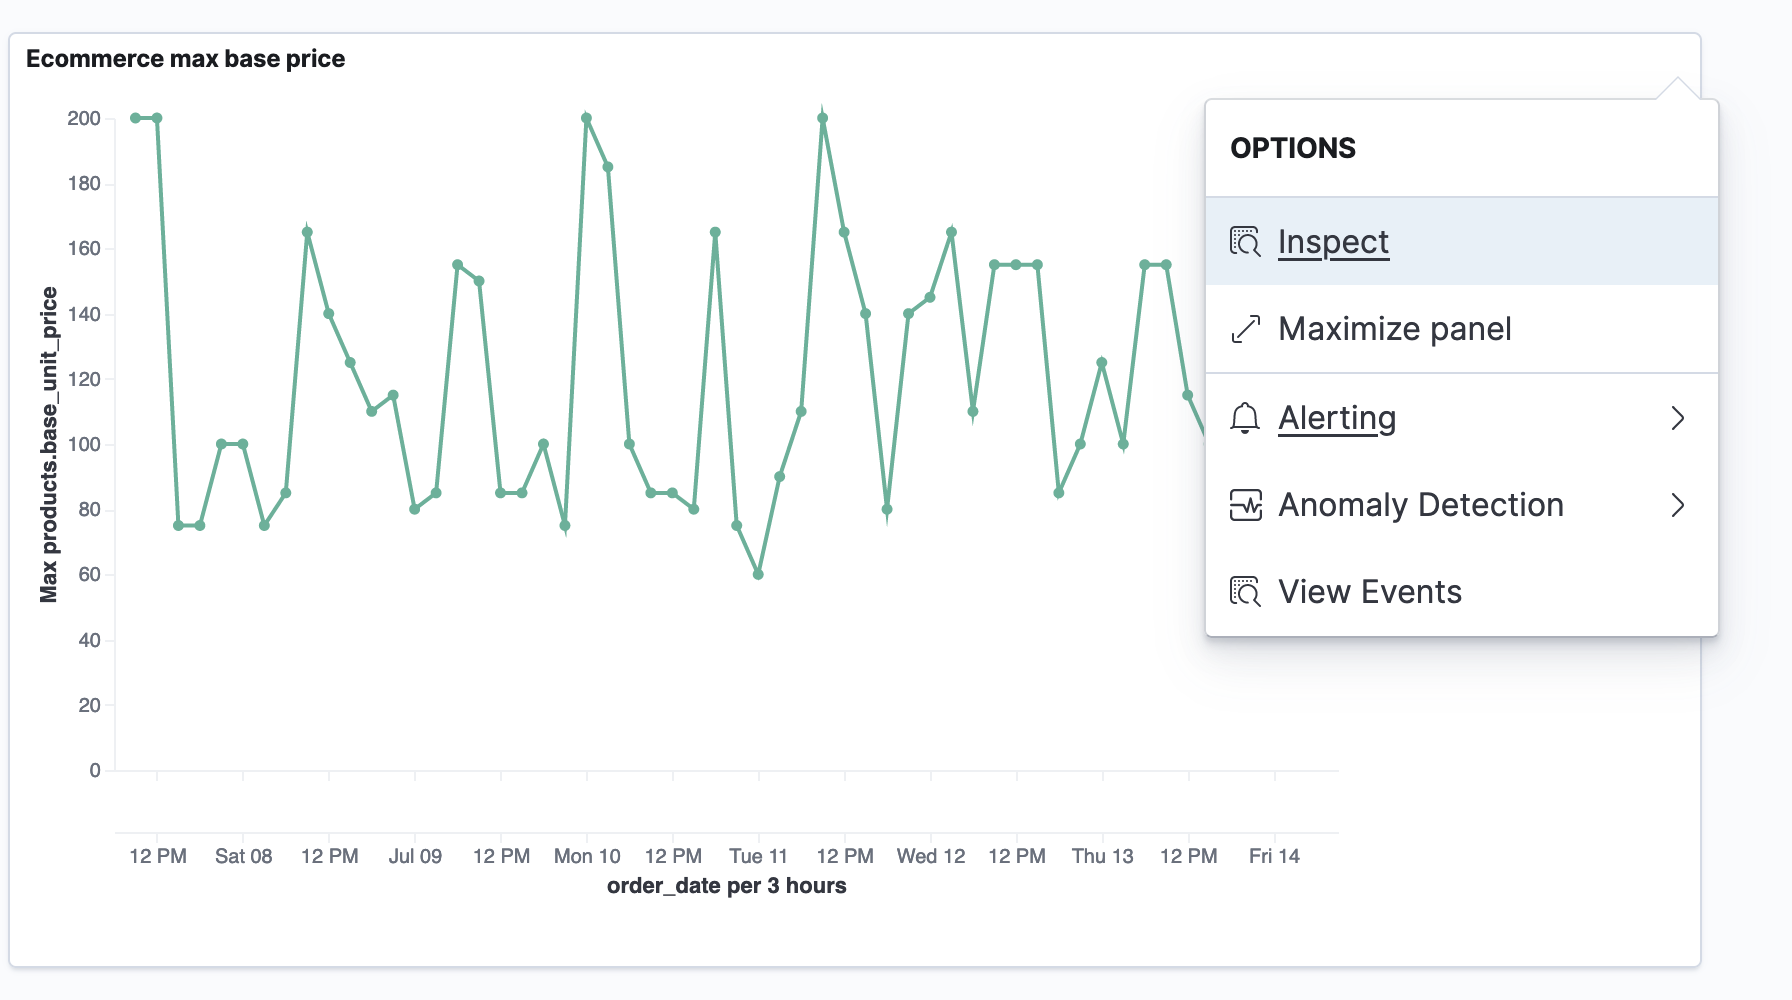
Figure 4. Alerting context menu
- Select Add alerting monitor from the Alerting dropdown context menu, as shown in the following image.
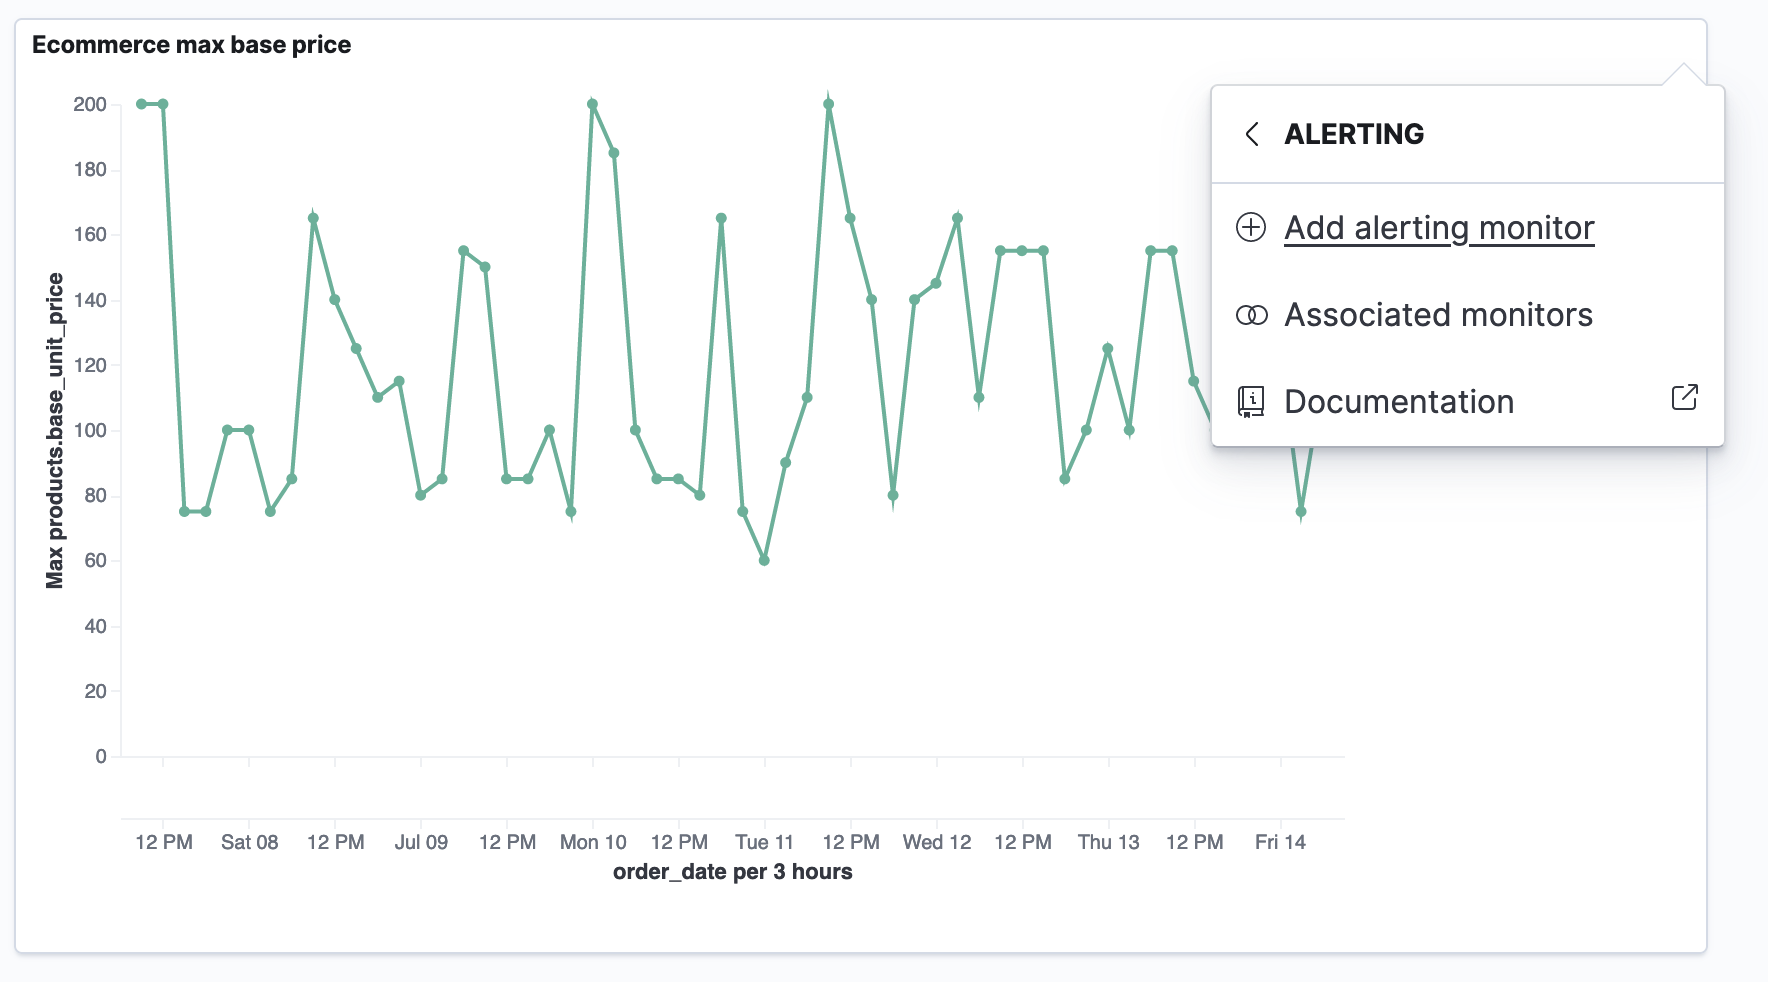
Figure 5. Add alerting monitor context menu
- Choose Create new monitor or Associate existing monitor.
- If you choose to create a new monitor, input the required information under Monitor details.
- If you choose to associate an existing monitor, select a monitor from the dropdown list under Select monitor to associate.
- Select Create monitor or Associate monitor, as applicable, to add the monitor to your visualization, as shown in the following images.
| Create monitor | Associate monitor |
|---|---|
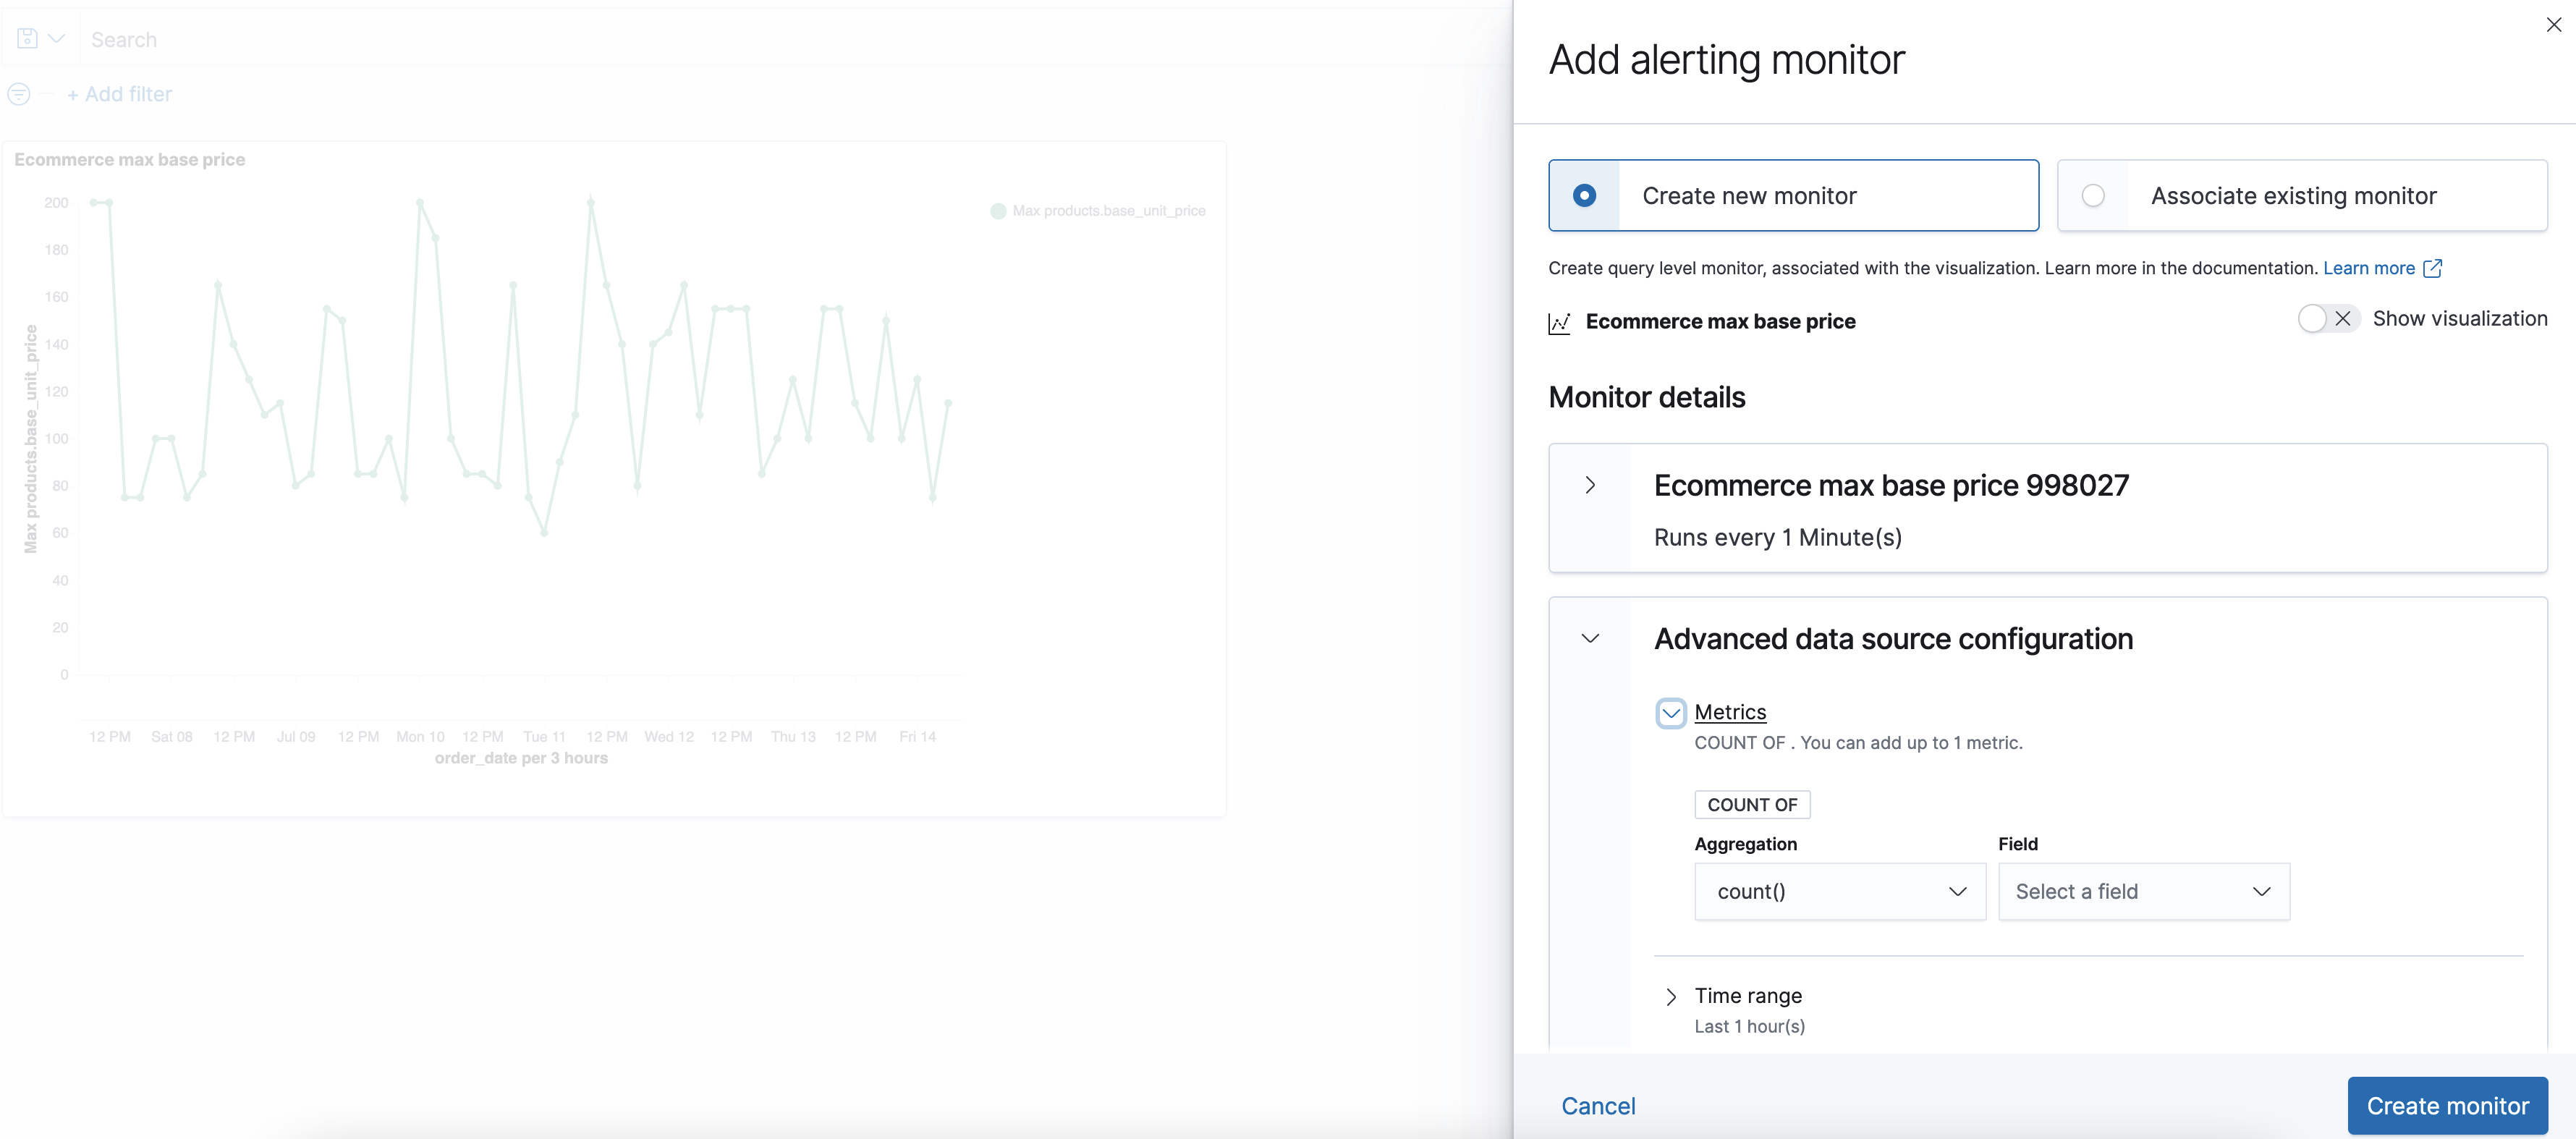 |
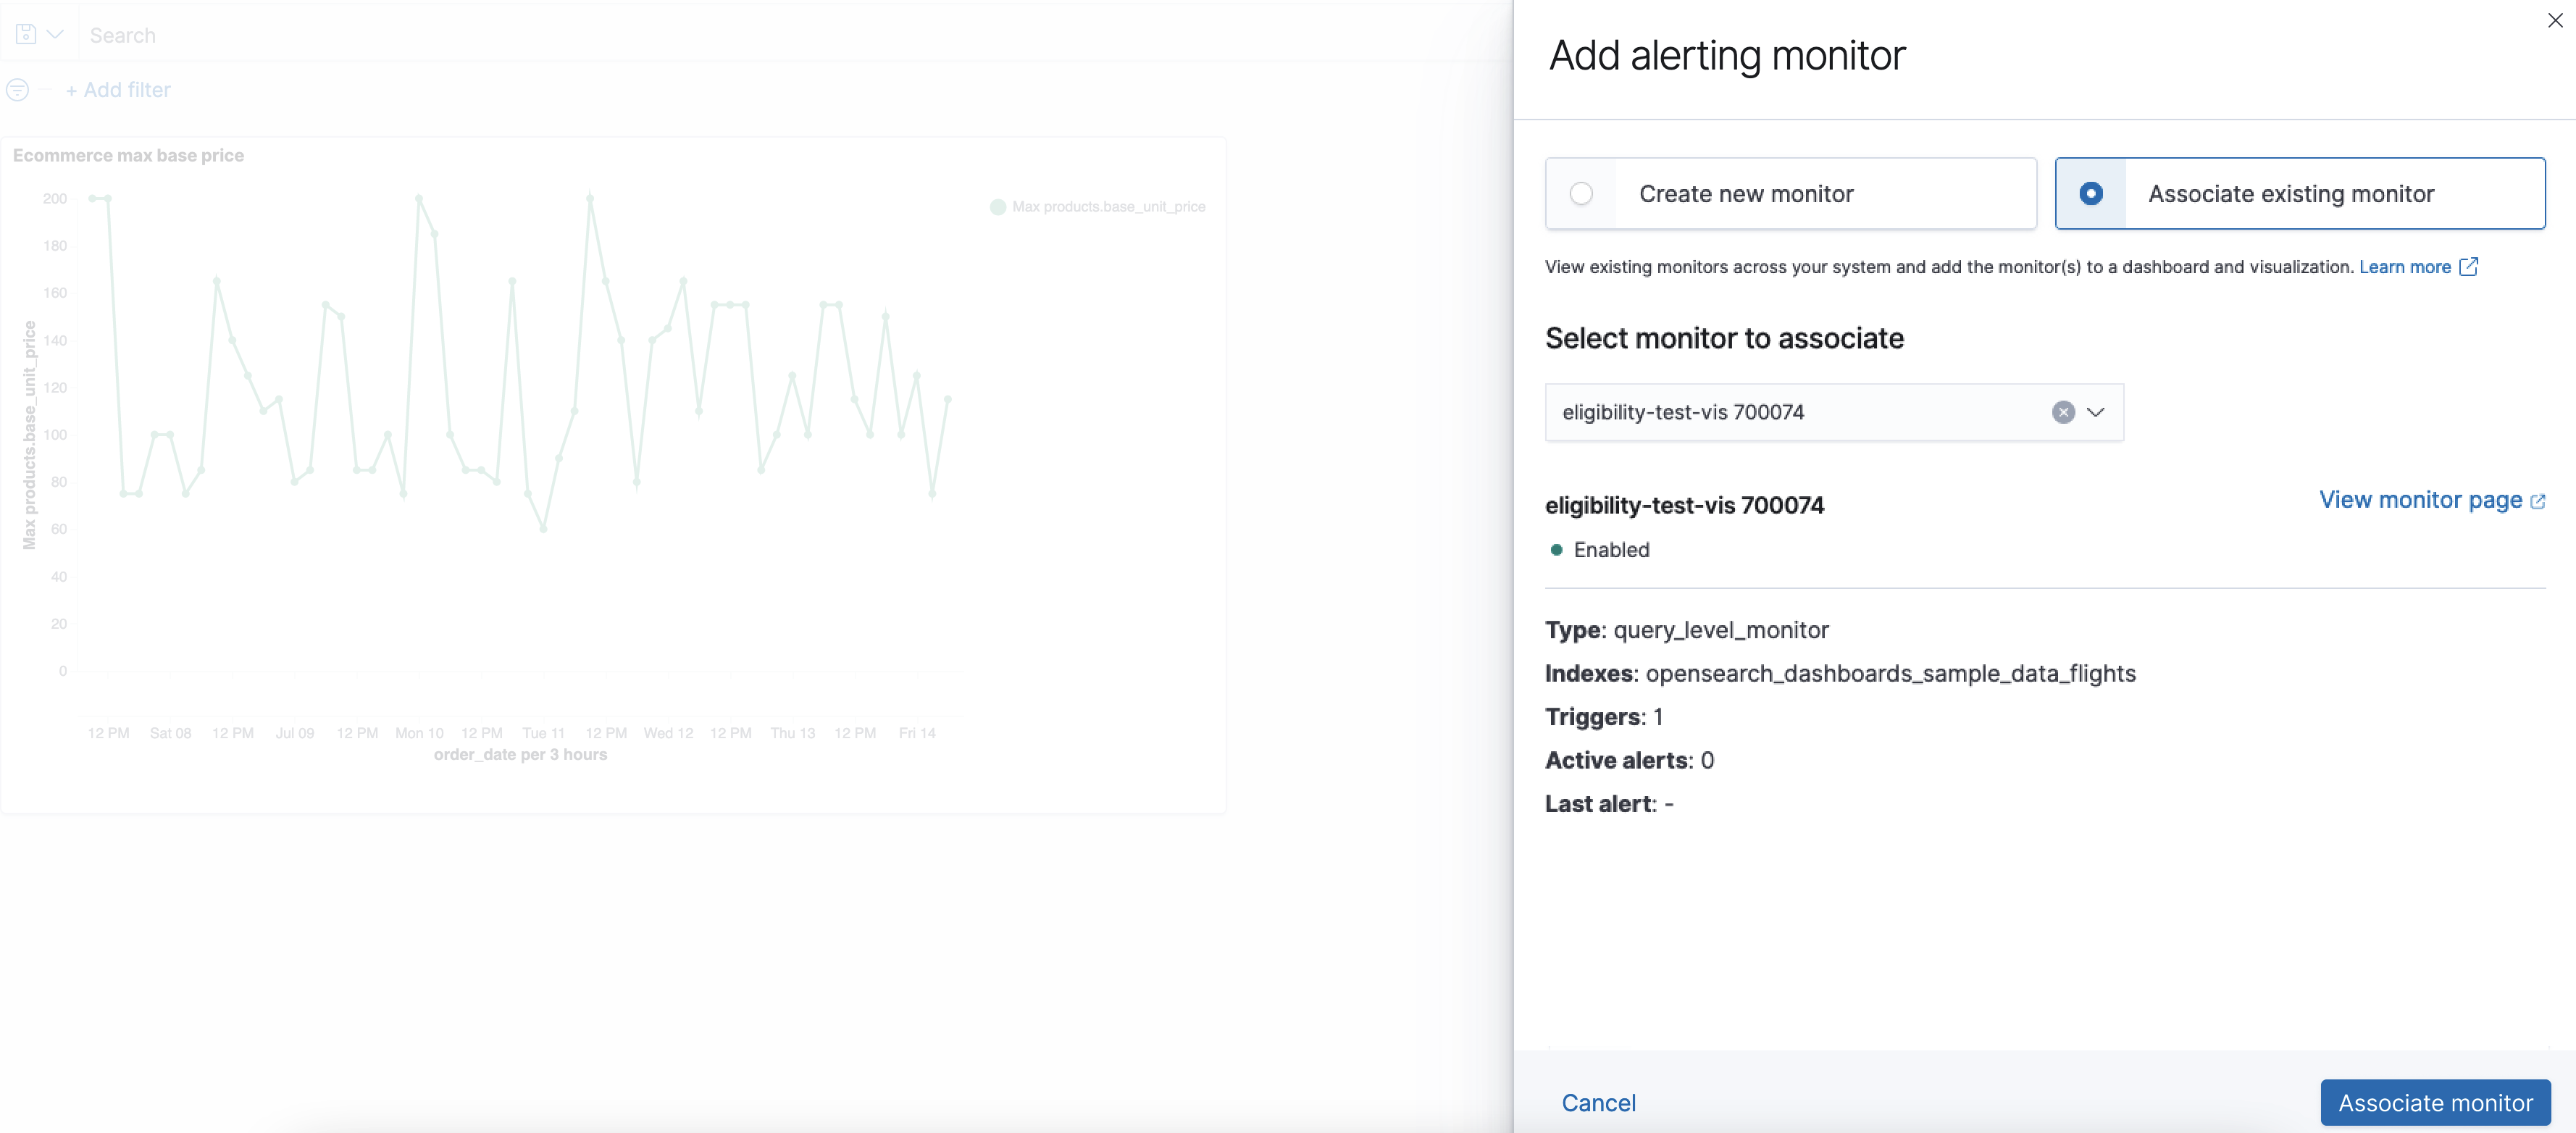 |
Viewing events
Regardless of whether you choose to create a new monitor or detector or to associate an existing monitor or detector, events on your dashboard are triggered based on the criteria you select. For a detailed view of the trigger criteria, go to the View Events page. You have two options for accessing the View Events menu: Select an event on the visualization itself or select View Events from the visualization’s context menu, as shown in the following image.
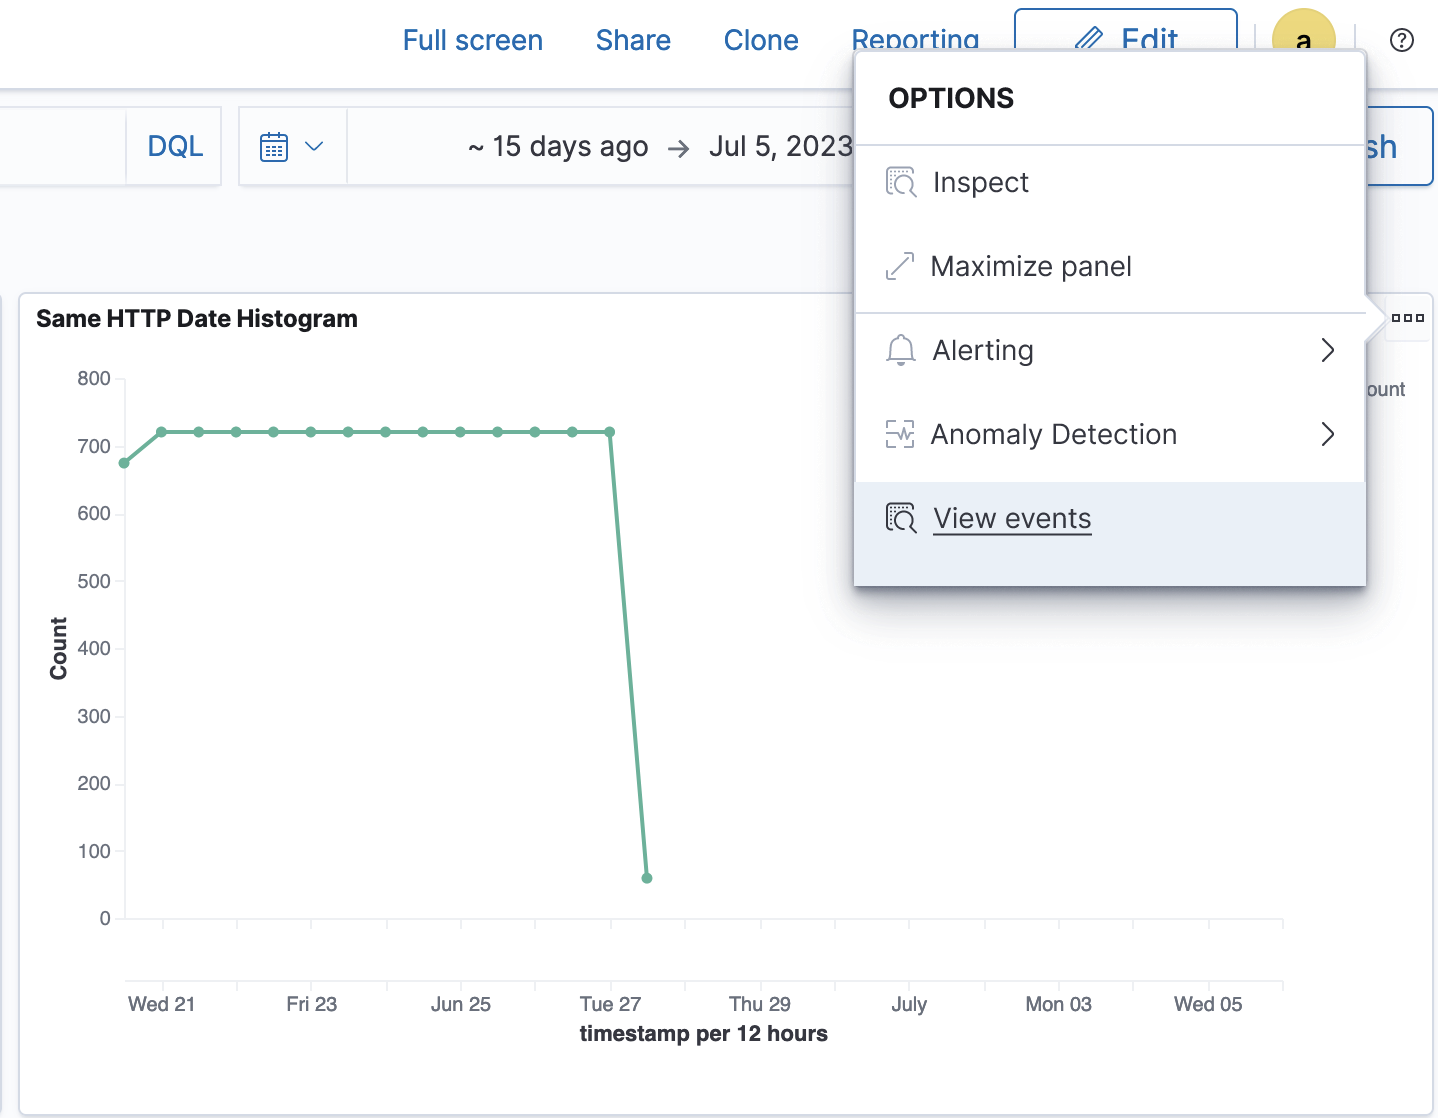
Figure 6. View events context menu
As shown in the following image, the events flyout has two sections. The top section displays the visualization with the same aggregate view of events and time range as the visualization on the dashboard. The events flyout can be refreshed to fetch any new data. The bottom section displays the specific event details. This section is arranged by plugin (Anomaly Detection or Alerting) and then by the individual plugin resources within that plugin (anomaly detectors or alerting monitors). In this view, you can see which plugin resources are producing events and when those events were produced. An overall event count for each plugin resource is displayed next to the resource name. To display more information about a specific plugin resource or the event it has produced, select the resource name. This opens a new tab that displays the resource details about that plugin. A time range is also fixed at the bottom of the flyout to help visually correlate individual events.
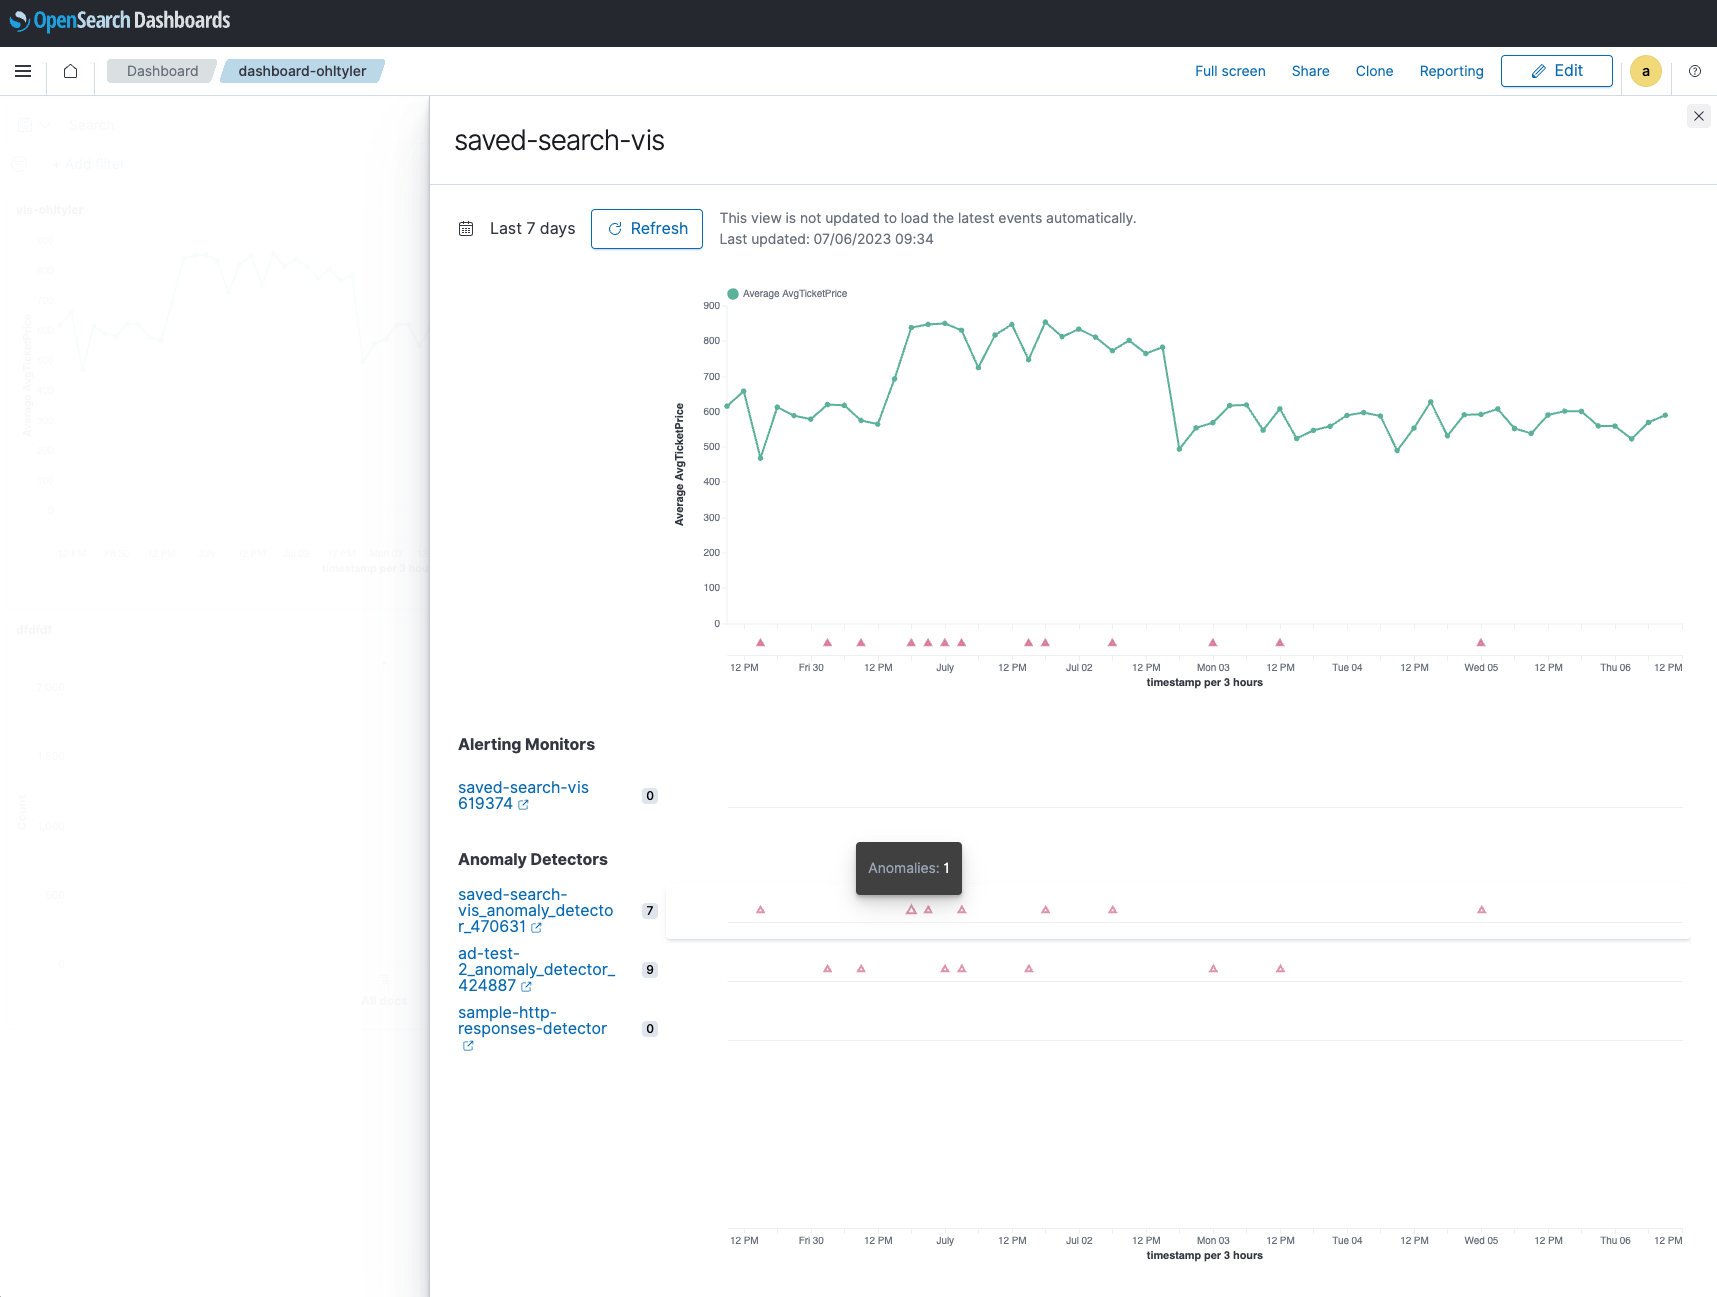
Figure 7. Events flyout showing alerting and anomaly detectors details and a line chart visualization
As part of our continuing work on this feature, we’re adding new components and making them common components so that you can use them in your own applications. We’re also working to remove these limitations:
- The number of objects associated with visualizations is limited to 10.
- Only line chart visualizations containing time-series data are supported.
We’ll have updates in the upcoming release, so stay tuned!
Community feedback
The OpenSearch Project wants your feedback about this feature. Let us know how we can improve the functionality and capability of the alerting and anomaly detection visualization workflows. You can leave your feedback in an issue in the Alerting repository or Anomaly Detection repository on GitHub.
This feature required a lot of collaboration, and we are especially grateful for the hard work and dedication of the following contributors: @lezzago, @ohltyler, @amitgalitz, @jackiehanyang, @xeniatup, @kamingleung, @KrooshalUX, @joshuarrrr, @ashwin-pc, @vagimeli, and @brijos.
Related resources
The following OpenSearch documentation provides more information about this feature:


